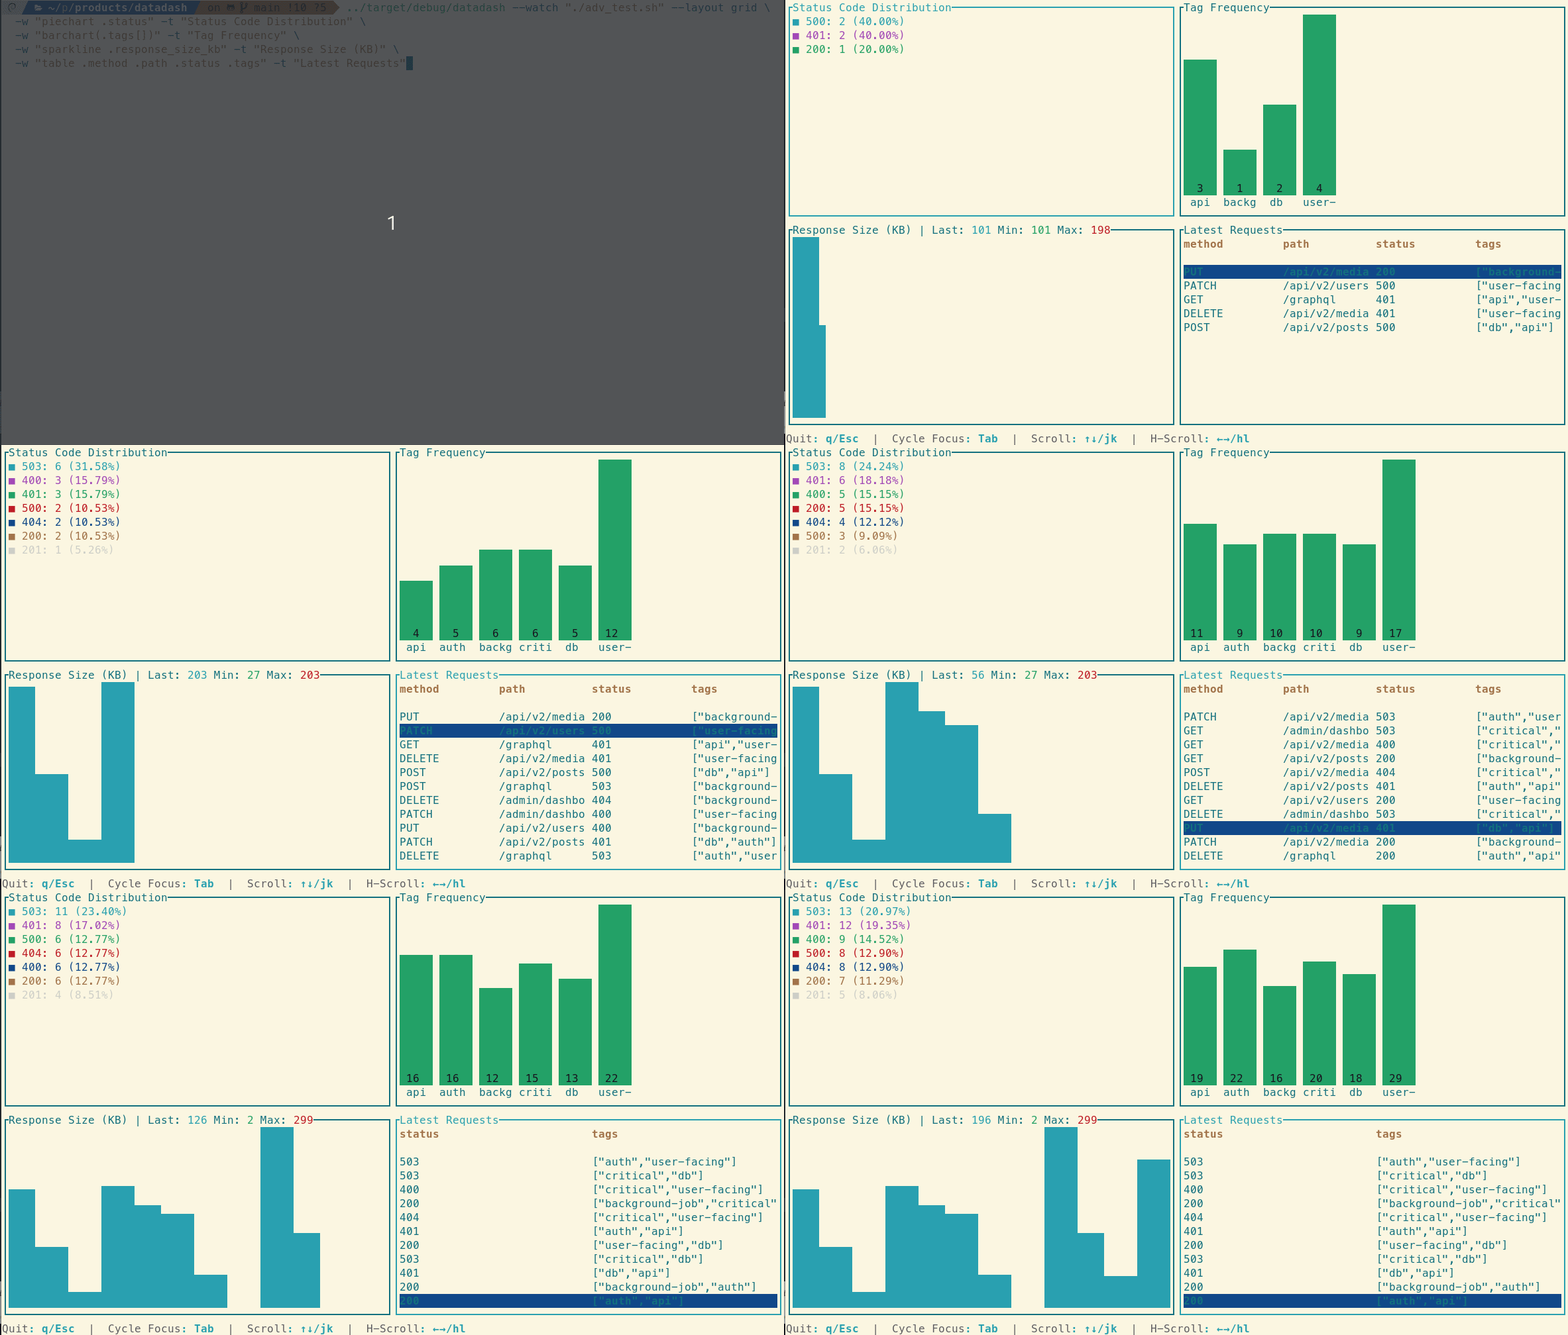
Instant Terminal Dashboards for Anything.
DataDash 📊 is a blazingly fast, pipe-able command-line tool for visualizing structured data (JSON) in your terminal. Built in Rust 🦀 for native performance and reliability. Stop scrolling, start seeing.
Install for FreeFrom Data Stream to Dashboard. Instantly.
Pipe any JSON Lines (.jsonl) stream into DataDash and define your widgets with simple, intuitive commands. Monitor logs, system stats, API responses, and more.
💡 Have a standard JSON or CSV file?
DataDash requires the JSON Lines (.jsonl) format. You can convert any file format, including standard JSON, using our sister tool, Datamorph.
$ datamorph convert your-file.json your-file.jsonl
Get Datamorph for free →

🎬 Want to see more? Explore our full library of practical recipes and see more GIFs of DataDash in action.
View All Use CasesMonitor Live Log Files
Tail a log file, convert it to JSONL, and monitor key metrics in real-time with the new `timeseries` widget.
tail -f access.log | datamorph -f common-log -o jsonl | datadash --follow \
-t "Requests / min" \
-w "timeseries .timestamp by 1m"
Inspect API Responses
Instantly visualize a JSON response from any API endpoint.
curl -s 'https://api.example.com/users' | jq -c '.[]' | datadash \
-t "User Details" -w "table .name .email" \
-t "City Distribution" -w "barchart .address.city"
Analyze Local Data
Dashboard large JSON or JSONL files right on your machine.
cat data.jsonl | datadash \
-t "Total Events" -w "count" \
-t "Avg. Latency" -w "barchart avg .latency_ms by .endpoint"
Powerful Widgets for Every Need
📊 Bar & Aggregation Charts
Visualize frequency counts or aggregate numerical data (sum, avg, min, max).
🕒 Timeseries ChartsPRO
Automatically bucket time-series data into intervals (1s, 1m, 1h).
📈 Line Charts
Plot numerical data with interactive zooming and panning.
📋 Tables
Display structured data in a clean, scrollable table with column aliasing.
📈 Sparklines
Track trends of numerical data in a compact, inline format.
🔢 Big Numbers
Highlight a key metric or a single important value with large text.
⭕ Gauges
Display a value as a percentage of a whole, from 0 to 100.
🥧 Pie Charts
Show the proportion of different categories as a percentage.
#️⃣ Counters
Display a running total of all data points that have been processed.
Free vs. Pro
| Feature | Free Tier | Pro Tier |
|---|---|---|
| All Core Widgets (Table, BarChart, LineChart, etc.) | ✅ | ✅ |
| Grid, Row, and Column Layouts | ✅ | ✅ |
| Read from File or Stdin | ✅ | ✅ |
| Append Mode for Watch (`--append`) | ✅ | ✅ |
| Timeseries Widget | ❌ | ✅ |
| Live Data Watching (`--watch`) | ❌ | ✅ |
| Live File Tailing (`--follow`) | ❌ | ✅ |
| Advanced Pre-filtering (`--where`) | ❌ | ✅ |
| Data Sampling (`--sample-rate`) | ❌ | ✅ |
Get Started in Seconds
DataDash is a single, portable binary with no dependencies. Install it with one command.
macOS & Linux (via Homebrew) Recommended
Install and manage DataDash using the Homebrew package manager:
brew tap Caelrith/datadash
brew install datadash
macOS & Linux (via Shell)
Open your terminal and run the following command:
curl -sSL https://download.datadash.dev/install.sh | shWindows (via PowerShell)
Open a new PowerShell terminal and run the following command:
irm https://download.datadash.dev/install.ps1 | iex